273
0
20
40
60
80
100
120
140
160
2004 2005 2006 2007 2008 2009 2010 2011 2012
Number of cases
Year
Total number
of cases
Gender male
Gender
female
No
identification
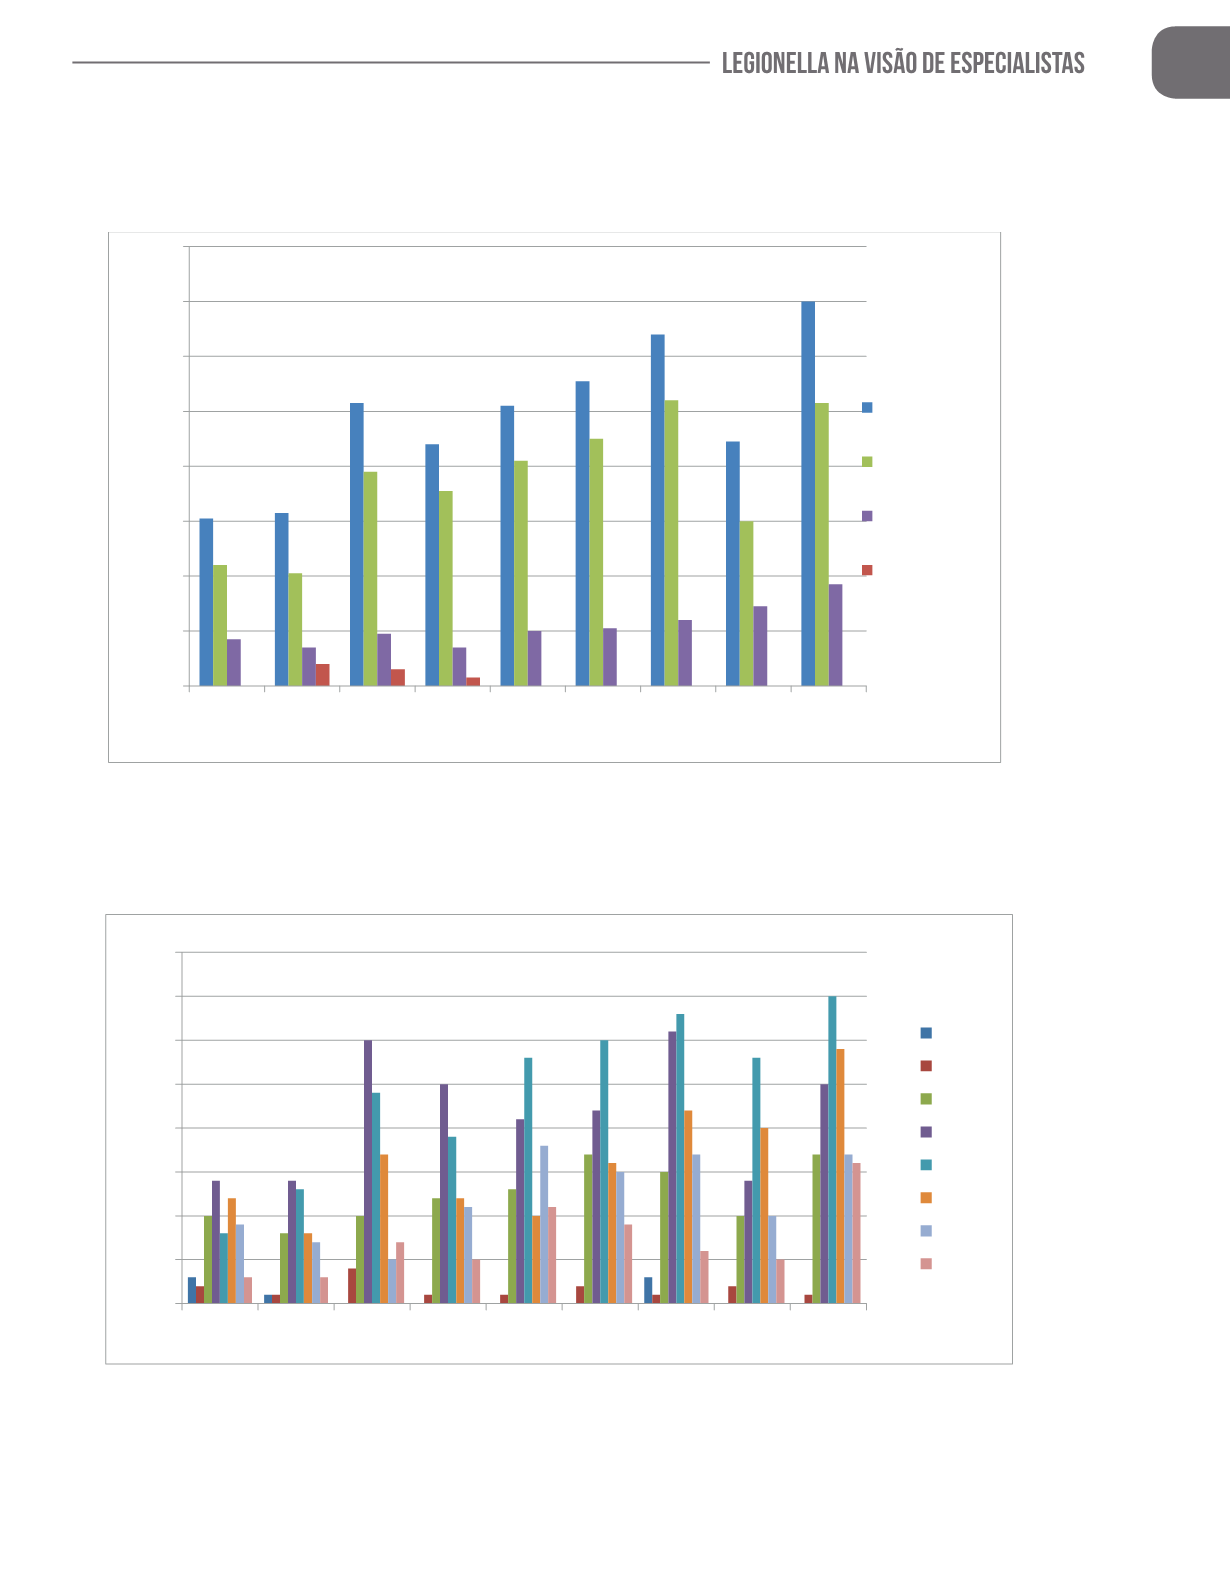
Data presentation of Legionnaires’ Disease in Portugal
Chart 1
–Number of cases of LD by gender, over time in Portugal (result of notifications through the Integrated
Epidemiological Surveillance Program 2004-2012).
0
5
10
15
20
25
30
35
40
2004 2005 2006 2007 2008 2009 2010 2011 2012
Number of cases
Year
0-19
20-29
30-39
40-49
50-59
60-69
70-79
80+
Chart 2
–Number of cases of LD by age, over time in Portugal (result of notifications through the Integrated
Epidemiological Surveillance Program 2004-2012).


